The movements of popular stock indices dominate the headlines, and all too often the psyche of investors. Given the large price increases in most stock indices for the year, it is tempting to think that the “opportunity set” for investors has been diminished. This is not, however, what we are seeing.
As of 6th December, the S&P 500 is up almost 21% for the year to date and only 3% below its recent all-time high. It’s global counterpart, the MSCI World index, is up almost 15% and around 5% below its all-time high. These indices are, however, weighted by the size of their constituents and so their movements do not reflect that of the typical company.
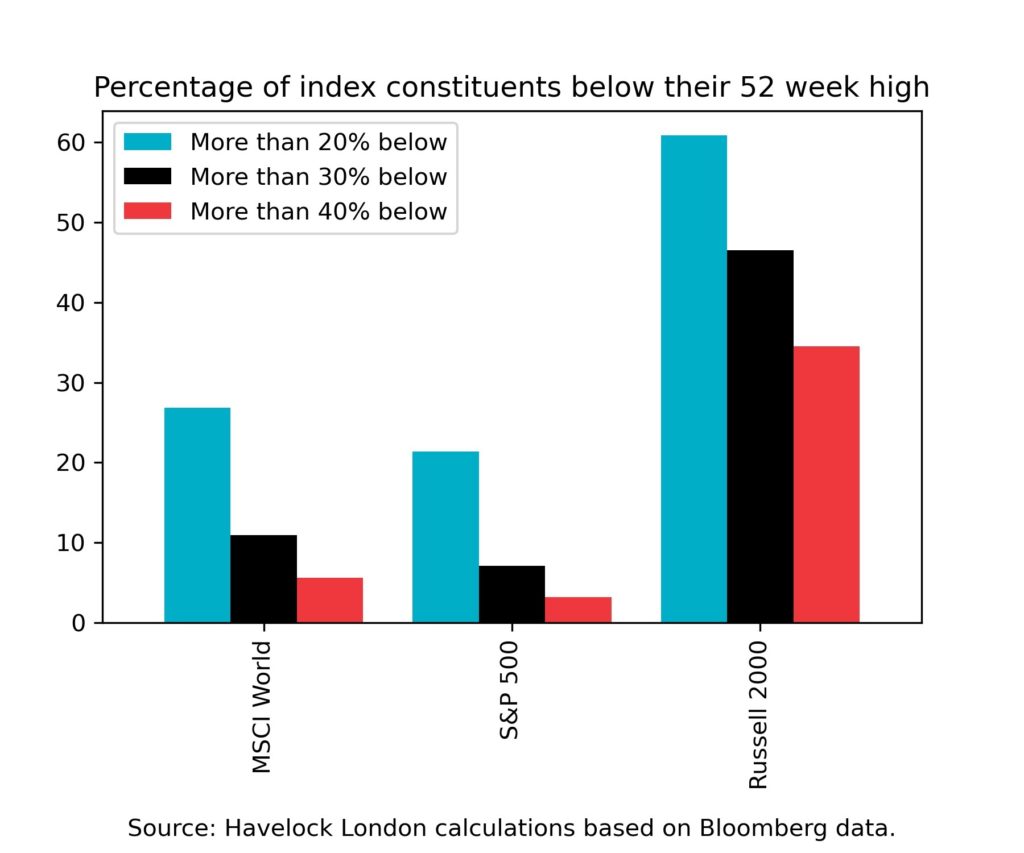
It is the case that many companies have seen price falls far greater than those of the popular indices. The average distance from the high of the last 52 weeks is 14% for S&P 500 companies, and 16% for MSCI World companies. The chart below shows the percentage of companies in these indices, together with the Russell 2000, that have seen large price falls. The chart contains three definitions of “large”, distinguished by the different coloured bars.

The analysis illustrates that almost one third of the companies in the MSCI World index have seen their prices fall by more than 20% from their 52-week high. The Russell 2000 index contains small and mid-cap American companies, is up 11% for the year and is 11% below its all-time high. This index has around two thirds of its constituents now more than 20% below their 52-week high. This all hints at the extent to which recent strong performance in the stock market has been driven by the very largest companies.
The technical definition of a “bear market” is a price fall exceeding 20%, and there are many individual companies that now meet this criteria. A fall in price does not automatically make something a bargain, but with large numbers of companies having seen price declines we believe it improves our chances of finding attractive investments.
A good number of the companies that we follow have experienced price declines in the past few weeks, influenced in part by the list being dominated by smaller “mid cap” companies.
Our job, as active investors, is to ascertain the extent to which these price declines reflect changes in underlying business prospects, versus changes in the animal spirits that we believe also drive markets. Where we believe that a price decline is far more driven by the latter, it gives us an opportunity to make an investment at an incrementally more attractive price.
We believe our opportunity set has materially improved in the last three months because we have seen many companies where the decline in their share price appears out of step with any reasonable analysis of their prospects. Whilst there can be no guarantee that any single investment will play out as per our analysis, we believe that broad price declines tend to tilt the odds in our favour.
One of the cornerstones of our investment approach is to value every business that we own and track. We use these valuations to estimate the intrinsic value of our portfolio, and its discount to current market prices. This gives us a way of quantifying the strength of our opportunity set, from the bottom-up, that we label “excess value”.
This bottom-up “excess value” measure says that we see more opportunity now, than we did at this time last year, having already produced some healthy returns so far in 2021. It is against this backdrop we feel a sense of optimism and, more importantly, have started to deploy some of our “dry powder” cash holdings.