The chart below shows the breakdown of total returns in the last decade for the MSCI World Growth and Value indices. We have shared this analysis in the past, and I thought it was worth producing an updated version.
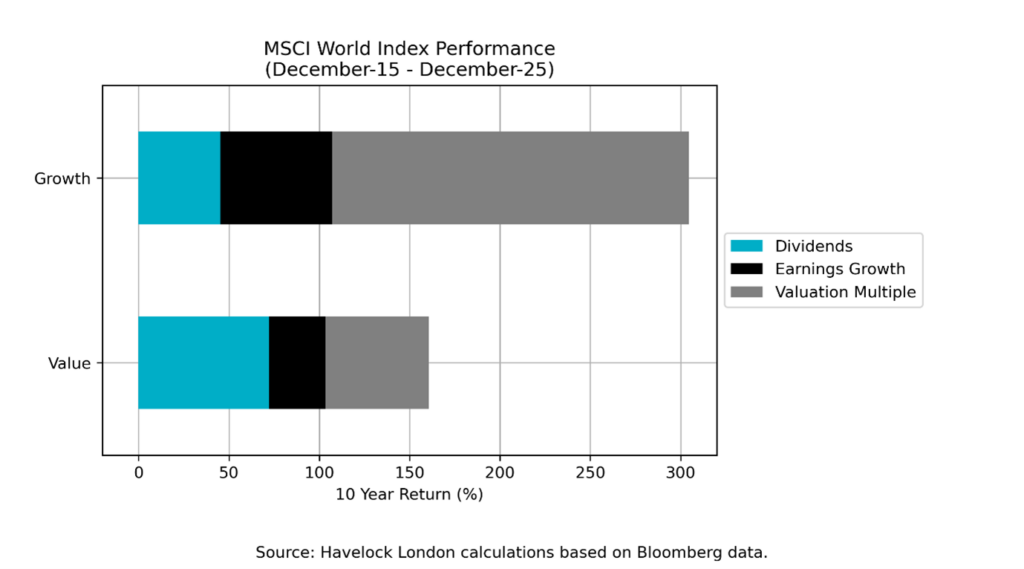
Although I bridle at the idea that companies can be classified as either “growth” or “value” based on just a couple of numbers, these types of style indices at least provide a means of looking beyond the overall market averages. We would like to think that our approach is more nuanced, but without doubt we will tend towards looking at companies that sit within the value index.
The chart shows that when considering just dividend payments and earnings growth, these two groups of companies delivered broadly similar results. However, changes in valuations (as measured by the share prices versus earnings) meant that on average companies in the growth index far outperformed those in the value one. Put simply, in the last decade many companies have seen their share prices grow much more quickly than profits.
I suspect that many investors will be feeling smug about large stock market gains, without understanding the extent to which they have come from ever-higher valuations. Although in most areas of life folk love a bargain, when it comes to markets there is a tendency towards people investing in whatever has done well, irrespective of why the share price went up. Not so for us.
I obviously have my view on what this chart means for the future, but I will leave you to draw your own conclusions!
What about quality?
The MSCI Growth and Value indices have a younger brother, in the shape of the MSCI World Quality index. All three originate from work on “equity factors”, where cohorts of companies are grouped together based on a set of quantitative characteristics. The quality factor was a comparative newcomer to the academic literature, with MSCI using return on equity, earnings stability, and balance sheet leverage to form a quality index.
I have seen increasing discussion on “quality companies looking cheap”, with the respected commentator Ruchir Sharma calling it a “once-in-a-generation” opportunity in the FT. On this basis it would be remiss to not say something on this subject. The earnings data that we have available for the MSCI Quality index does not however extend back as far as for the Value and Growth indices, which makes it hard to include it in the previous chart (since our preferred measure of earnings growth for indices is a decade-on-decade measure which requires 20 years of data). So, instead, I just show rolling historic PE ratios for the three indices below, which give an indication of how expensive they appear versus each other and history.
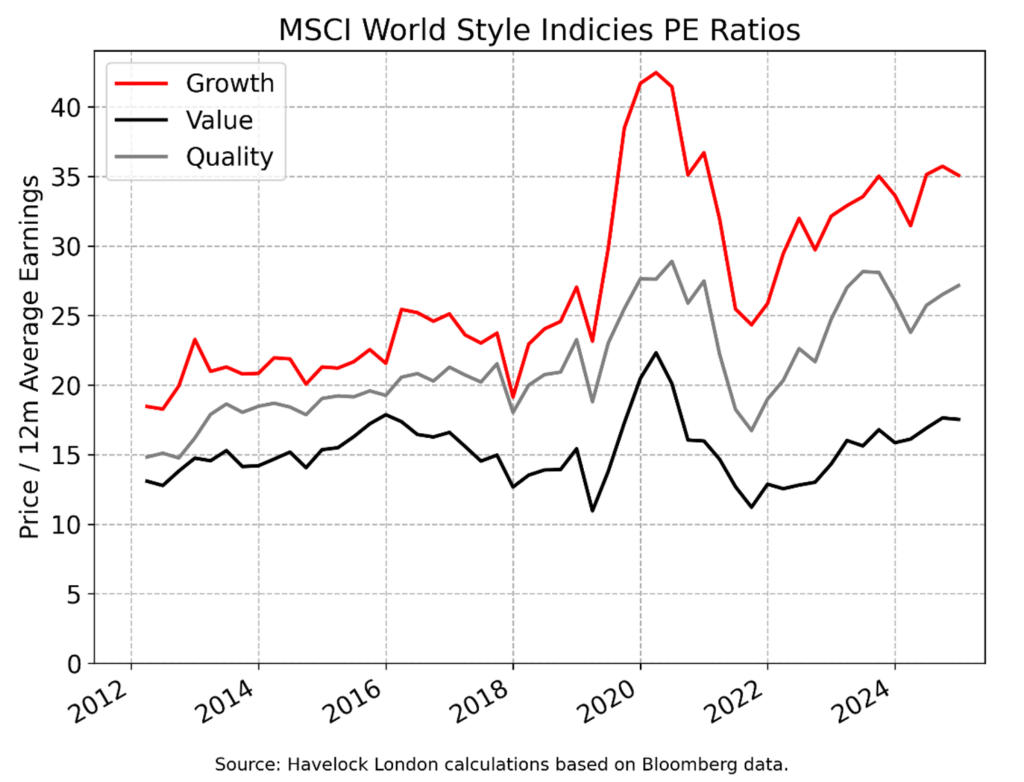
The argument for “quality looking cheap” seems to be based on it having underperformed the market cap weighed indices last year, but this chart shows that the MSCI Quality index doesn’t look cheap relative to its own history. Whilst I suspect that there are clusters of “quality companies” that are cheap versus history, it doesn’t appear to be the large-cap companies that dominate this index.
As I have written in the past “beauty is in the eye of the beholder”. We think that “value”, “growth” and “quality” are all subjective concepts that feed into the desirability of a given investment case. Narrow quantitative definitions of these factors are useful analytical tools but are also subjective and are by necessity superficial. Our approach is to look at individual companies, “warts and all”, and use this to form a view both on their desirability as an investment and what we would be willing to pay for them.