The economic shutdown that we are living through is without precedent in modern history. The US unemployment rate has moved in a matter of weeks to 15.7%, the highest it has been since 1940. In the UK 27% of the nation’s workforce have been furloughed. Once the full impact of the shutdown is reflected GDP falls are expected to exceed anything that we have seen in living memory. This is set against world debt at an already high level of $253 trillion, or a surprising $33,000 for every man, woman, and child who inhabit our small planet.
Governments and central banks have acted to socialise the cost of the pandemic shutdown, shouldering much of the financial burden that would otherwise have fallen on businesses and individuals. This is analogous to the way we socialise the cost of firefighting, whereby we collectively pay for a service that will try to save your home from burning without first needing the swipe of a credit card.
It remains highly uncertain as to when the flames of the pandemic will be judged to be extinguished and what lasting economic damage there will be. I believe that until we have more scientific certainty around the characteristics of the virus and the potential for vaccines or immunity, no one can know what the immediate future looks like for the economy. State support during the pandemic has taken many forms, financed by massive increases in Government debt. Central banks have been using newly “printed” money to purchase much of this debt, alongside the debt of private companies that otherwise would have struggled to find willing lenders. The motivation of these efforts is to limit lasting economic damage.
The reaction of stock market participants in the face of this support has been for the world’s major indices to recover much of their lost ground with the prices of companies perceived to be insulated from the crisis moving back towards earlier levels. Furthermore, rock-bottom interest rates are cited as a catalyst for investors wanting to park their money in stock markets as the alternatives look distinctly unrewarding. The question that I think investors need to ask is who will likely pay the bill for fighting the pandemic?
Historically a rapid expansion of government debt is, ultimately, followed by either repayment or default. Repayment comes from a combination of raising revenue and shrinking the size of the debt via inflation (arguably repayment can be indefinitely delayed but this is a form of default). I presume that the world’s major economies are borrowing with the intent of repayment, and with low growth rates there will be pressure to either cut spending, increase taxes, or create inflation in the years ahead.
In my opinion the use of printed money to fund the bailout increases the risk of inflation as there is a historical precedent of this being the case. In recent history we have seen low inflation according to measures across baskets of goods and services, but high levels of asset price inflation. I believe that globalisation and offshoring to countries with cheap labour costs has been a major driver of this trend. If global tensions continue to rise, there is a risk that this dynamic may change.
I believe that we are already seeing the early stages of the argument over who should pay play out on the international stage. Examples of this are the spat between Germany and the ECB, as well as the rising tension between the USA and China. I think that in due course we will also see such arguments taking place within countries. I believe that the austerity measures and tax cuts that followed the last crisis will not be palatable second time around and that there will be pressure to raise taxes.
I am not a believer in making macro-economic forecasts and I do not know what the future will hold. However, I believe that investors need to be mindful of what could happen, especially where it would be a break from recent history. I want to ensure that our portfolio will be robust to a range of different possible scenarios. The narrative above is motivated to explain that I think there is an increased risk of inflation, anti-global sentiment, and rising corporate taxes.
I fear that the rapidity of the stock market “recovery” underestimates the chances of lasting economic damage, but more strongly believe that it ignores the risk that the corporate “winners” from this crisis will be called on to help pay the bill. I think that after the previous financial crisis much of society has a limited appetite for “privatised gains” and “socialised losses”. To this end I think that we will see a renewed interest in “digital taxes” on technology company profits.
What are we doing in response to these concerns?
I do not believe that there is a silver bullet answer, but I am proceeding with the assumption that we are still only seeing “Act 1” of this crisis, with the recent price falls hinting that “Act 2” might be about to begin. I am cautious about viewing the companies that are immediate “winners” of the crisis as being a sound investment at any price, especially if they “win” at the expense of other parts of the economy.
I have been spending time looking at each of the companies that we own, questioning if our original investment hypothesis has been superseded by the events of the crisis. Are there assumptions that once looked reasonable that now look optimistic? I believe that it is imperative to find the middle ground between panic and wishful thinking when evaluating a company’s prospects.
I believe that a strong balance sheet is now more important than ever and have been focusing more attention on the most highly leveraged companies in our portfolio. I have also been able to lean on our valuation models, with those companies that show up as looking very cheap or very expensive warranting more attention. The net impact of this is that we have undertaken a higher than normal level of “rotation” within our portfolio, exiting the holdings of companies where we think our investment thesis is damaged and increasing holdings where we have conviction that we see good value without undue risk.
I wish I could offer our investors more certainty at a time like this. My conviction is that remaining true to our philosophy of long-term value-oriented investing will make for the best possible chance of us doing a good job in navigating this crisis.
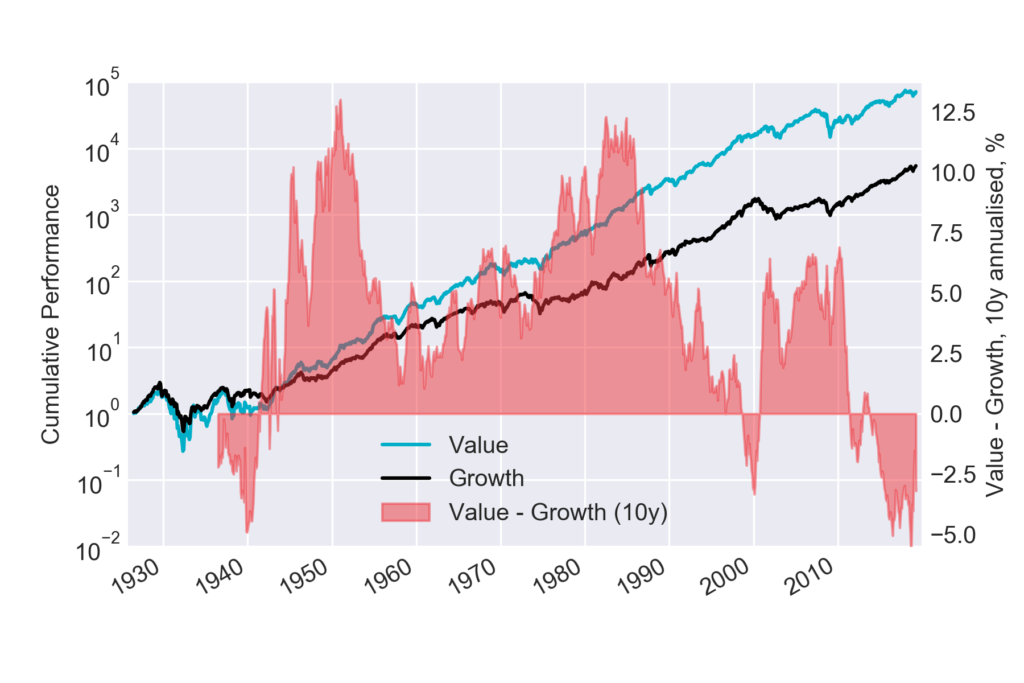
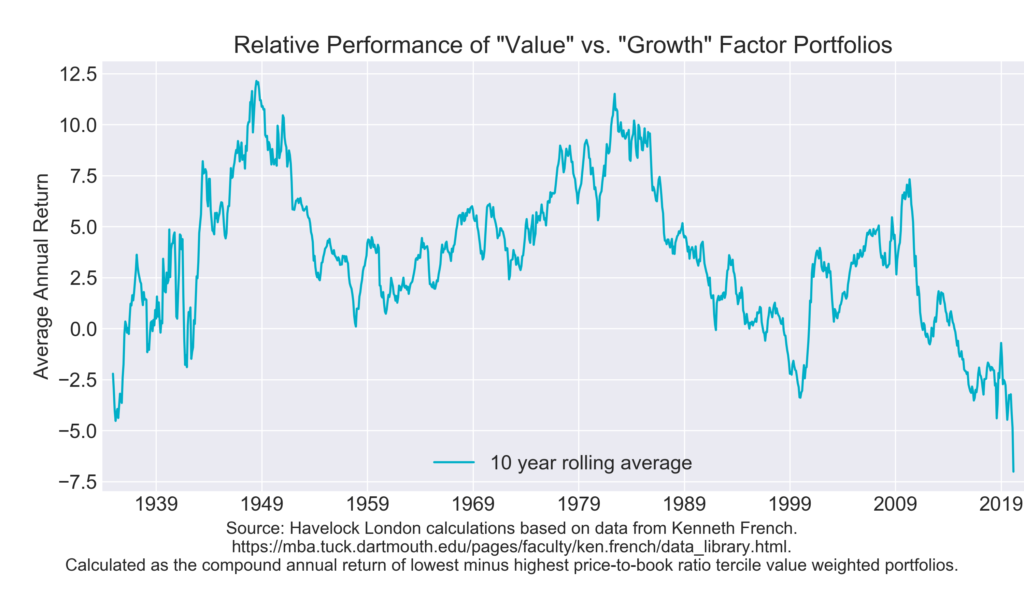
There is no single definition of value investing, but according to many broad definitions it has seen a long period of underperformance relative to “growth” oriented investing. There is a wealth of information available elsewhere on this topic, but I finish with a chart that shows the relative performance of “value” and “growth” factor portfolios over almost the last 90 years. Such “back tested” results need to be treated with caution, but it shows that “value” has outperformed for much of the last century but had a record under performance in the last ten years. I believe that history is on the side of the value investor and that a reversal of this recent underperformance has the potential to create a tailwind for us in the years ahead.
Any readers who have made it this far may still be left asking what a root fire is?
“A root fire is a fire that burns underground along the root system of a tree. It’s a very dangerous form of fire because the fire can smoulder for months underground, long after the surface part of the fire has been extinguished.”
Given the threat of subsequent virus peaks we thought it an apt title!
In the meantime, I hope you and your families remain in good health.
Matthew Beddall
References:
US Unemployment https://www.bls.gov/web/empsit/cpseea10.htm https://www.thebalance.com/unemployment-rate-by-year-3305506
Global debt https://www.iif.com/Portals/0/Files/content/Global%20Debt%20Monitor_January2020_vf.pdf