With summer fast approaching, it rekindles memories of perusing the wine list on holiday and being confronted with many unfamiliar names, producers, and grape varieties, with the occasional familiar ‘brand’. The latter is often accompanied by a price-tag several multiples higher than the cost of buying the same bottle at home, and we are left with a quandary. Are we prepared to pay more for familiarity, and if so, how much? Or do we trust the experience and recommendation of an expert (in this case, a sommelier), in the hope of enjoying a superior wine, at a much more reasonable price?
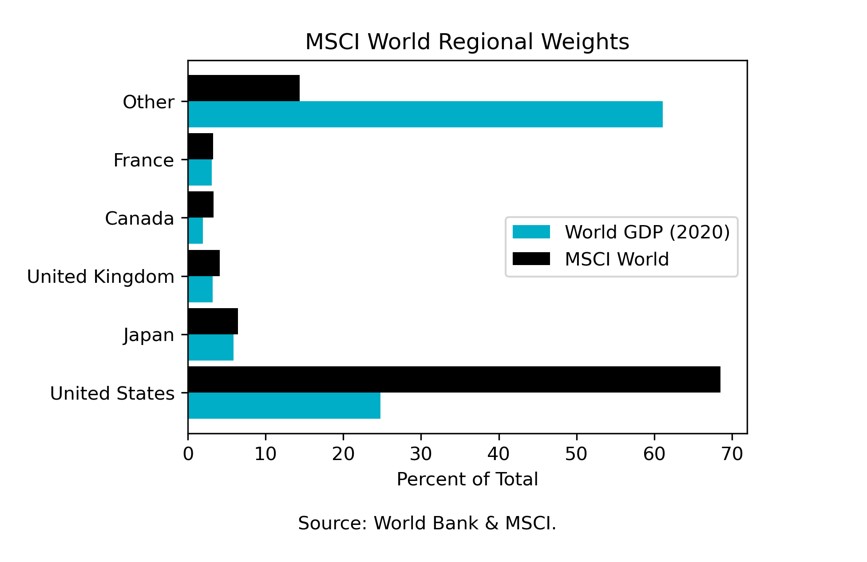
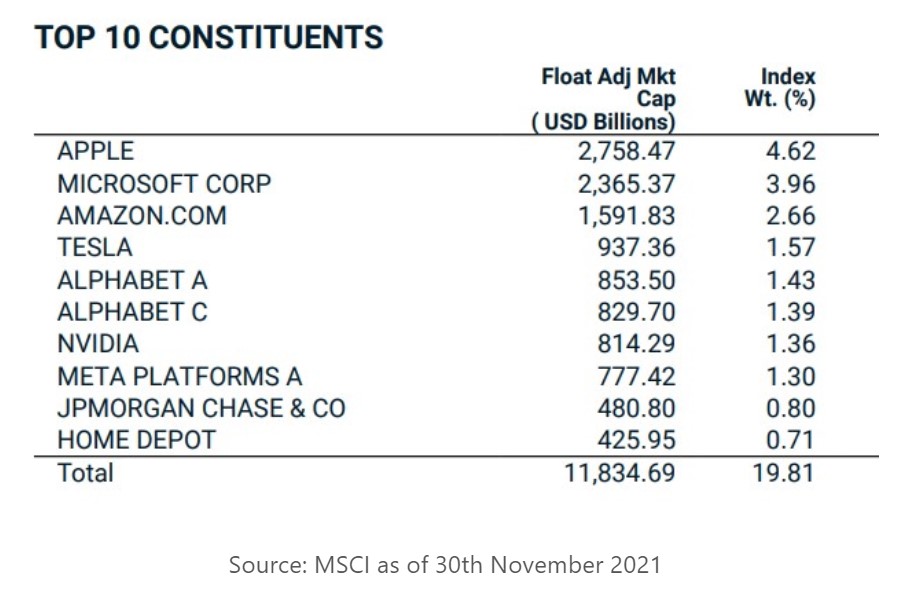
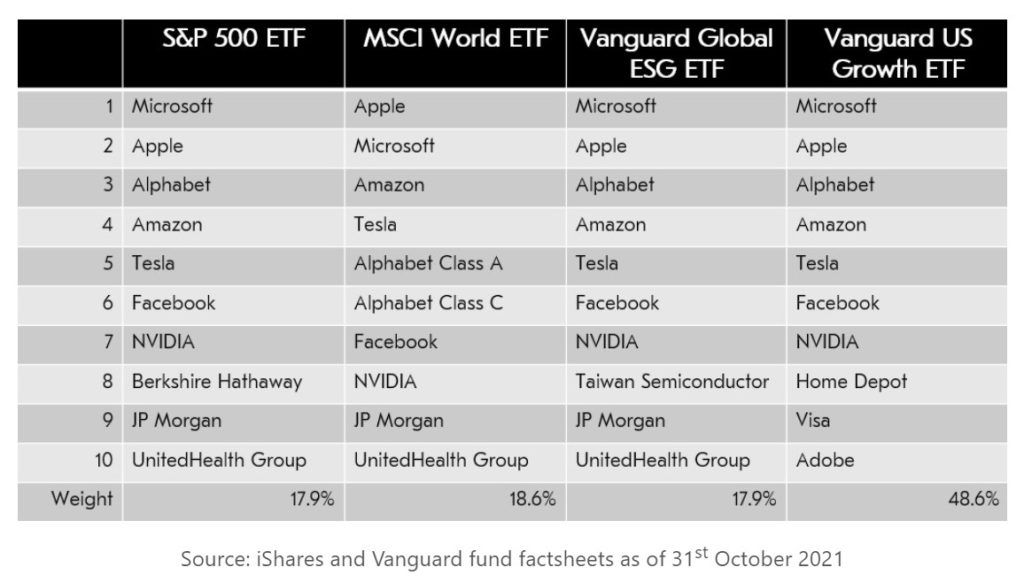
We have written previously that, after a decade of delivering incredible returns, the US (which remains 68% of the MSCI World Index*), ‘growth’ as an investment style, and the 10 largest companies, all dominate many investment portfolios. However, the first 4 months of 2022 have shown that perhaps some of the price premium paid for familiarity by ‘price insensitive’ buyers (typically retail investors or passive index trackers), hasn’t resulted in the enjoyable experience they were hoping for. Now that the share prices of some of these companies have fallen, there may be an opportunity to buy them for less of a premium, but what about trying something new, which could also be high-quality, but less familiar?
Just as with labelling all wine simply ‘red’ or ‘white’, labelling over 40,000 listed securities as either ‘growth’ or ‘value’ is overly simplistic. As part of our ‘quality value’ approach to investing, we look to identify companies that have a long track-record of operating success, conservative balance sheets and that appear attractively priced. Every candidate investment is evaluated against a quality ‘scorecard’, which features 14 different factors, using a combined quantitative and qualitative approach. This is very different from many traditional deep-value funds that tend to use only simple valuation metrics to identify opportunities, and perhaps pay less attention to the quality of what they are buying.
As a boutique asset manager, our company may be less familiar to you than some of the industry heavyweights. It’s also likely that there are company names in our fund’s top 10 holdings which will be less familiar too. By thinking outside the (wine) box, you may just uncover a boutique, with a rigorous and disciplined investment processes, which invests in quality companies without necessarily paying a ‘familiarity premium’.
*Source: MSCI