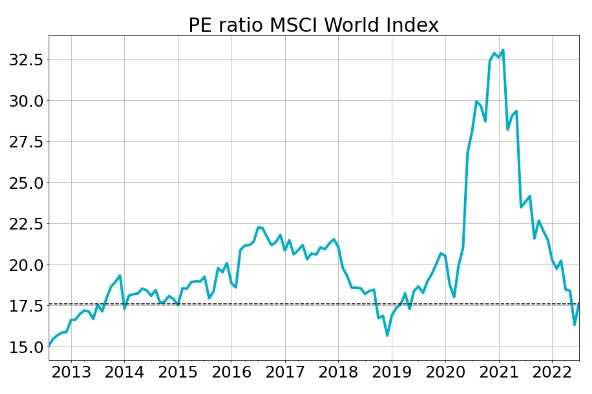
After a sharp rally in July that saw many previous stock market darlings recover some of their earlier falls, investors could be tempted to ‘think it’s all over’. The 10-year chart below shows that the price earnings multiple of the MSCI World Index had fallen to levels last seen in the depths of the COVID pandemic and suggests that many recent buyers might have been motivated to grab a bargain.
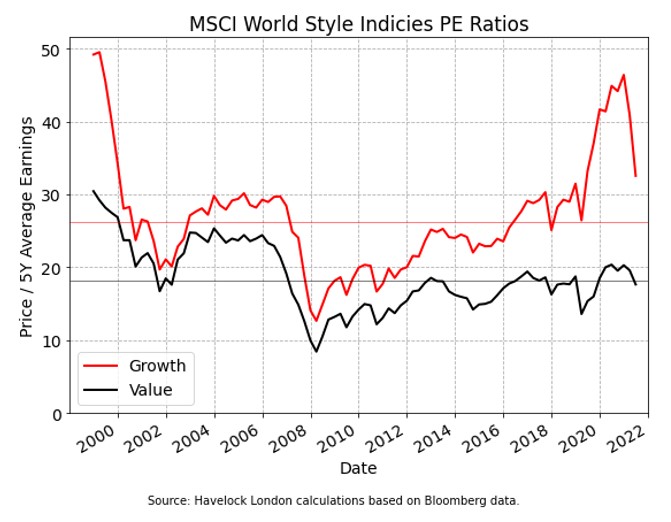
There is a joke amongst statisticians that the man who lays with his head in an oven and feet in a freezer is, on average, comfortable. The message is that statistics can often be misleading. In the chart above, summarising all 1,600 companies that are in the index with a single statistic really is not telling the whole story. MSCI produce ‘growth’ and ‘value’ indices that crudely divide these companies into one of the two classifications and despite being far from perfect, these indices tell a very different story to the chart above.
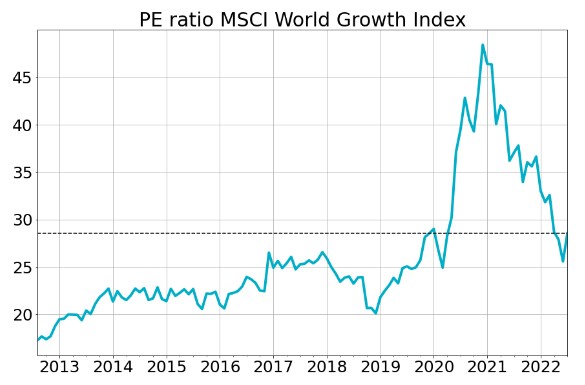
The chart of the price earnings ratio of the MSCI World Growth Index below shows that despite a significant fall, the index still stands at a 28x multiple., which hardly makes it look to be in bargain territory.
Conversely, the price earnings ratio of the MSCI World Value Index, below, shows that it has fallen to its lowest level in the last decade.
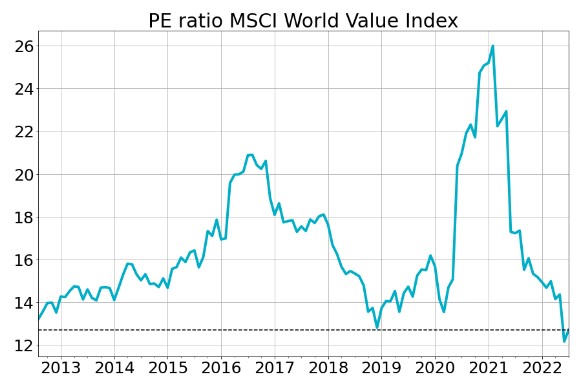
The first chart suggested that many excessive valuations, apparent at the start of the year, had moved to more sensible levels. However, when going only slightly deeper the data suggests that many companies in the MSCI World Growth Index could still be exposed to significant valuation risk. In comparison the MSCI World Value Index looks cheap on this measure.
Our approach to investment analysis runs much deeper than looking at simple valuation metrics, but despite the short comings of this analysis it hints at the opportunities we are finding. We believe that not all the companies that have seen large valuation falls are yesterday’s ‘has-beens’ and through patient analysis we believe there are now many more quality businesses available to buy at attractive prices.
*Note: The dotted lines in each of the charts shows the latest value.